Monitor Windows Network Throughput
A comprehensive guide on measuring Windows network throughput using modern built-in utilities like Task Manager and PowerShell performance counters without relying on obsolete software.
Table of Contents5 sections
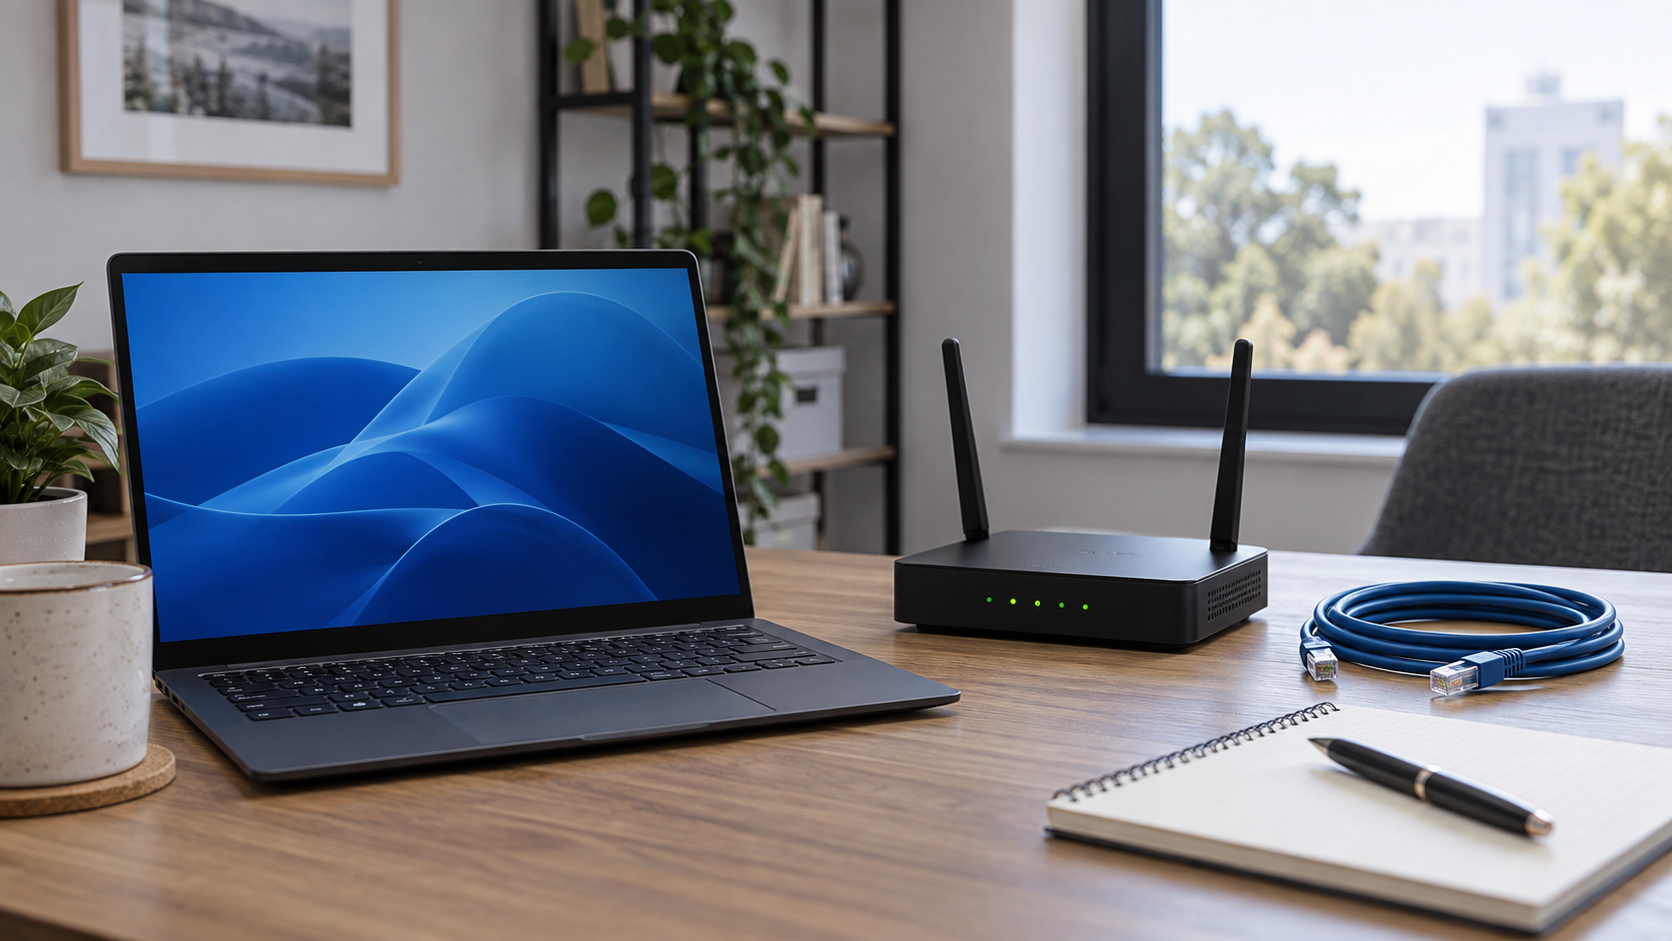
Current Windows tools can measure network throughput without relying on obsolete tray utilities.
How do you reliably check your actual internet speed or network transfer rates on Windows without installing abandoned third-party utilities or risky tray applications? Many desktop users search for a way to display live network speeds directly in the taskbar. Historically, this led administrators and casual users alike toward small third-party binaries that often stopped functioning after major operating system updates, or worse, introduced security risks and unnecessary resource overhead.
The core problem is not merely finding a visual indicator of data movement, but understanding how to measure network throughput accurately, distinguishing between maximum link capacity and actual real-time payload transfer. Modern Windows environments provide robust, native telemetry tools that eliminate the need for legacy utilities. By leveraging built-in diagnostic interfaces, you can obtain precise measurements for troubleshooting connectivity issues, auditing background application behavior, or verifying local file transfer speeds.
Understanding Network Measurement Semantics
Before running any command or opening a diagnostic Managing Context Window Limitations In Ai, it is helpful to clarify what different metrics actually represent. Link speed refers to the negotiated physical or wireless connection rate between your network interface card and your router or switch. If your operating system reports a Wi-Fi link speed of 866 megabits per second, that figure represents the maximum theoretical capacity of the local radio link, not your active internet download speed.
Actual network throughput, by contrast, measures the volume of data successfully transmitted across the interface over a specific interval. This metric fluctuates based on protocol overhead, Monitoring Server Side Fcm Notifications Effectively capacity, local congestion, and hardware limitations. Confusing link speed with throughput is a common mistake that leads to frustration when a connection performs well on paper but struggles under heavy load.
Task Manager and command-line diagnostics measure actual payload movement. When you evaluate network activity, you must also account for virtual adapters, such as virtual private networks or container bridges, which can obscure the physical interface. Knowing which adapter is actively processing your primary traffic stream is the first step toward accurate diagnosis.
Using Task Manager for Visual Diagnostics
For a quick visual inspection, Task Manager provides a reliable graphical overview of network performance. Press Control, Shift, and Escape to open the application, navigate to the Performance tab, and select your Ethernet or Wi-Fi interface. The resulting graph plots network utilization against a dynamic time scale, displaying current send and receive rates in kilobits or megabits per second.
Task Manager calculates these values by sampling the underlying operating system performance counters at regular intervals. While convenient for spotting sudden spikes or continuous background downloads, the GUI lacks historical logging capabilities and does not export data for external analysis. It is an ideal tool for immediate confirmation, but insufficient when you need to record network behavior over an extended period.
To get the most out of Task Manager, right-click the network graph and change the view to show network utilization percentages or cumulative bytes. This adjustment helps you determine whether a bottleneck lies in your local hardware interface or your broader internet service connection. However, when automation or remote diagnostics are required, the graphical interface falls short, necessitating a command-line approach.
Scripting Measurements with PowerShell
When you need repeatable, scriptable data collection, PowerShell offers the Get-Counter cmdlet. This command queries the Windows performance counter infrastructure directly, providing programmatic access to exact byte counters for every active network interface. You can run a simple command in your terminal to sample incoming and outgoing traffic without installing any additional software.
Consider the following PowerShell snippet designed to query the current bytes sent and received per second on your network adapters:
Get-Counter -Counter "\Network Interface(*)\Bytes Total/sec"
This command retrieves real-time performance data across all available network interfaces. Because modern systems often feature multiple virtual adapters, the output can be verbose. To isolate a specific physical adapter, you can refine the counter path by supplying the exact interface name discovered through standard networking cmdlets.
Performance counters operate on delta measurements, meaning the system calculates the difference in total bytes transferred between two consecutive sample intervals. This design prevents integer overflow and yields an accurate rate of transfer. You can wrap these commands inside a loop to log network activity to a CSV file for post-processing and trend analysis during network troubleshooting sessions.
Handling Common Edge Cases and Failures
Diagnostic scripts and native tools occasionally encounter obstacles, particularly on systems with complex virtual networking configurations. If Get-Counter returns an error stating that the specified counter path cannot be found, the underlying performance counter definitions may require rebuilding, or the target interface name may include special characters that require wildcard matching.
Another frequent issue involves virtual private network interfaces. When an active VPN connection routes all traffic through a virtual tunnel adapter, the physical Ethernet or Wi-Fi adapter may show near-zero utilization while your total throughput remains high. Always verify your active routes using standard routing tables before concluding that a network interface is failing to transmit data.
Additionally, permission boundaries can restrict access to performance metrics. Running diagnostic scripts inside an elevated PowerShell session ensures that the operating system grants access to low-level hardware counters. By understanding these edge cases, you avoid misinterpreting normal operating system behavior as a hardware fault.
Practical Takeaway
Relying on abandoned tray utilities for network monitoring exposes your system to unnecessary compatibility issues and security vulnerabilities. Windows provides all the necessary telemetry out of the box. Use Task Manager for immediate, visual verification of link activity, and turn to PowerShell performance counters when you need reproducible logging or scriptable diagnostics. Matching your diagnostic tool to the specific question at hand ensures accurate troubleshooting without cluttering your desktop with obsolete software.
Continue Exploring
You Might Also Like
Android ABI Filters: How to Choose Architectures Without Breaking Devices
A practical guide to Android ABI filters, native library packaging, 32-bit and 64-bit support, and testing architecture choices across real devices.
Why Android Push Notifications Duplicate and How to Fix Them
A practical debugging workflow for duplicate Android notifications, covering FCM payload ownership, stable notification IDs, PendingIntent identity, and idempotent handling.
How to Handle Partial Success in Android ViewModels
A practical pattern for Android mutations that succeed before a follow-up refresh fails, without lying to the user or turning Compose callbacks into orchestration code.